SAN FRANCISCO REAL ESTATE MARKET UPDATE – September 2021
September 1, 2021
Real Estate

September 1, 2021
Real Estate
1Real GDP is inflation-adjusted GDP. All references to GDP use Real GDP figures.
_________________________
Key Topics and Trends in August
We’re about a year past the initial economic devastation caused by the pandemic. The second quarter of 2020 saw the largest single-quarter drop in GDP in history (-9%). GDP and employment together reveal much about the economic climate and typically trend with housing prices, but they do not explain the current rise in home prices. We’ll still discuss GDP and employment, however, because they are useful longer-term indicators.
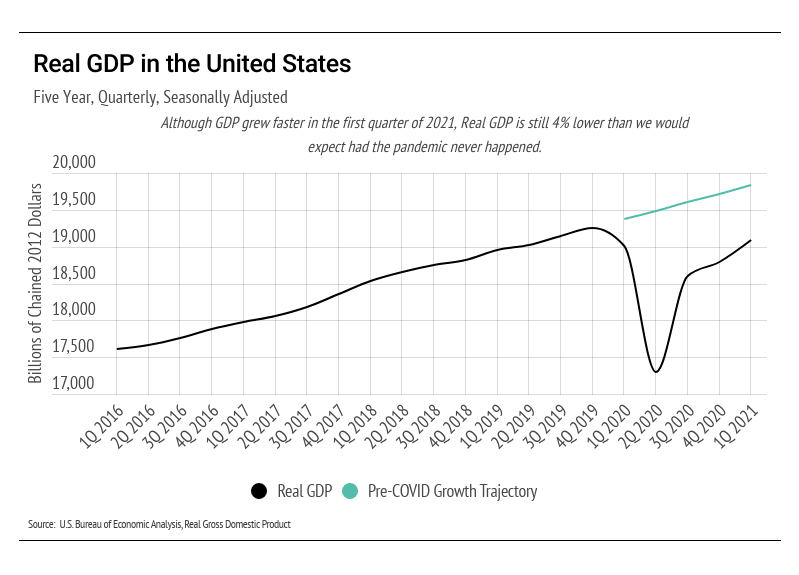
The U.S. Bureau of Economic Analysis reported a 1.6% quarter-over-quarter gain to GDP in 1st Quarter (1Q) 2021, which is about 1% higher than the long-term quarterly growth rate of 0.6%. We need to outpace the long-term growth rate to get back to pre-pandemic levels. If it weren’t for the Delta variant, we might actually get there. The substantial infusion of cash into the economy has boosted GDP, but we’re still only at 70% of pre-pandemic levels. At the same time, there are about 10 million fewer jobs due to the pandemic. As the Delta variant runs through the country, our recovery will likely stall and the loss in GDP could be permanent.
The chart below illustrates the cost of a recession. While it depicts U.S. GDP from 2016 to 1Q 2021, it also illustrates economic patterns that occur in all recessions. GDP tends to grow at a fairly consistent rate during economic expansions. The green line illustrates the expected GDP had the pandemic never happened. As that green line shows, we are 30% below where GDP was expected to be in 1Q 2021. In other words, we’re still underwater despite the impressive quarterly increases in GDP.
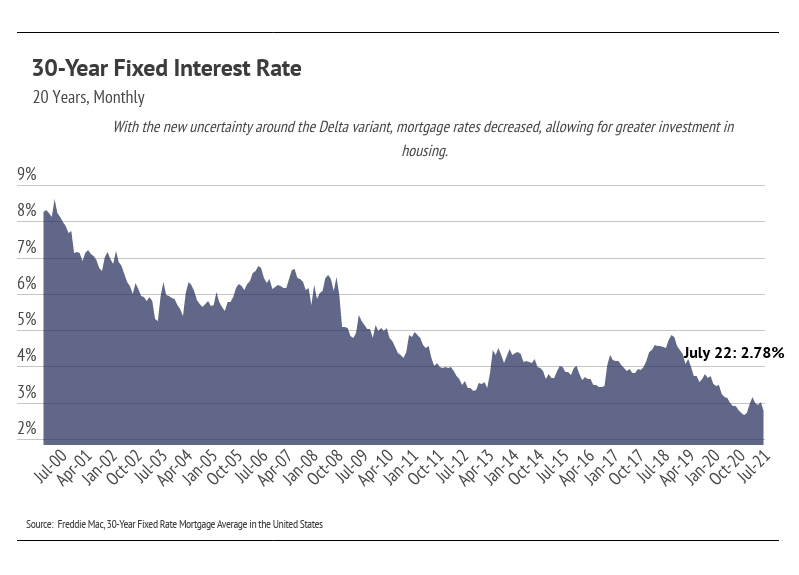
The fresh uncertainty surrounding the Delta variant caused rates to drop. The Federal Reserve is expected to support the financial markets by infusing money into them, which lowers rates and, in this instance, causes inflation to rise. As shown in the chart below, we’re currently hovering at historically low mortgage rates, which will likely remain for the rest of the year. Low rates and inflation both incentivize buying. When consumers know that the dollar’s purchasing power is diminishing quickly, it makes more sense for them to buy a home sooner rather than later.
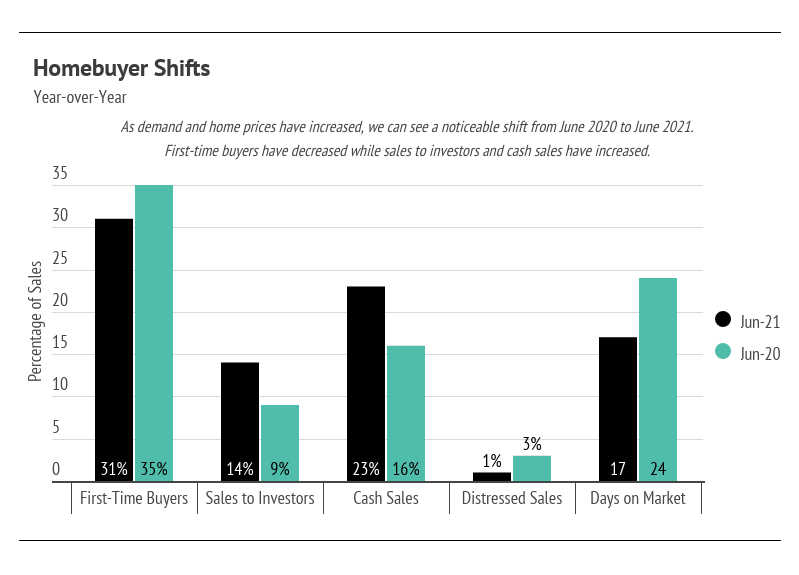
Demand for homes hasn’t diminished as prices soared over the last year. In a typical year, we would expect that a 20% increase in home value would price many potential homebuyers out of the market, thereby causing a price correction. In this instance, we’ve found that to be half true. First-time homebuyers are usually the first to get priced out of the market. Over the past year, we are seeing fewer first-time buyers coming into the market. However, even though there may be fewer buyers in one category, there are plenty of buyers in other categories to make up for them. In this case, we are seeing more investors coming into the market. Cash sales have jumped considerably, and homes are selling extremely quickly. As a result, it looks like prices will climb higher in the near future.
While the market remains competitive for buyers, conditions are making it an exceptional time for homeowners to sell. Low inventory means sellers will receive multiple offers with fewer concessions. Because sellers are often selling one home and buying another, it’s essential that sellers work with the right agent to ensure the transition goes smoothly.
_________________________
August Housing Market Updates for San Francisco
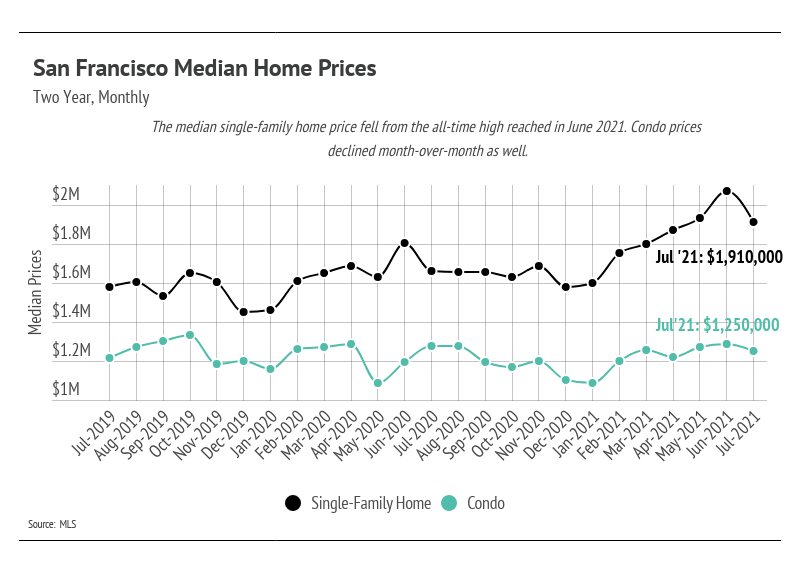
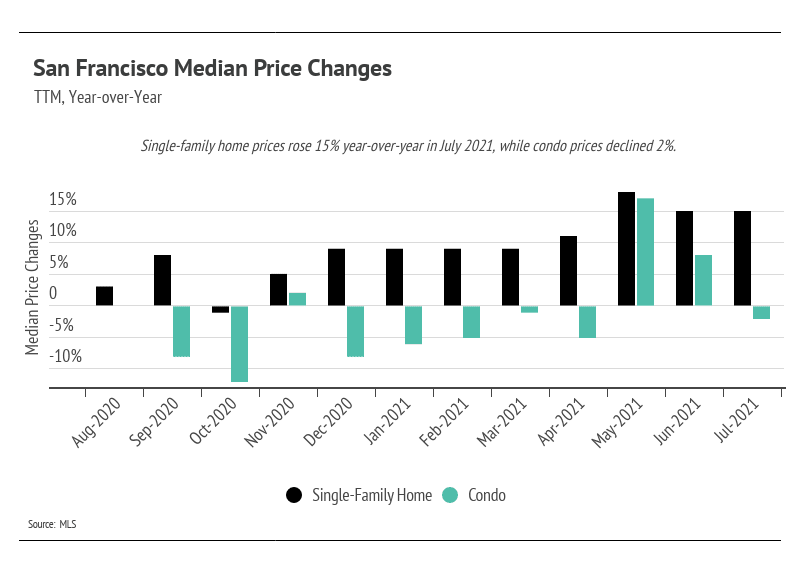
During July 2021, in San Francisco, the median single-family home price declined from the all-time high reached in June. Condo prices declined as well, but not as significantly as single-family homes. Year-over-year, single-family home prices increased meaningfully, up 15%, while condo prices declined 2%.
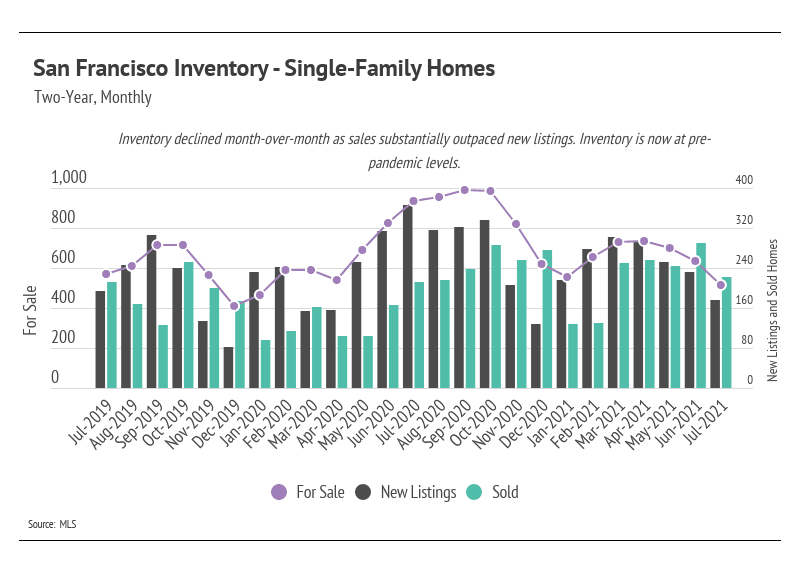
Single-family home inventory has declined significantly over the last three months and is now at pre-pandemic levels. To fully understand current inventory, we must look at it in the context of last year. In 2020, single-family home inventory increased to its highest level since 2011. From May to September 2020 (five months), inventory exploded. Despite such a meteoric rise, inventory fell even faster than it rose, which speaks to the desirability of San Francisco. By January 2021, inventory had declined to lower levels than in January 2020, then ticked up slightly from February to April before going lower from May to July 2021. As you can see from the chart, sales outpaced new listings in June and July, lowering inventory below pre-pandemic levels. Higher and higher prices have done nothing to curb demand. June had the second-highest number of sales in a month over the last 24 months with record high prices. With such a consistently high level of demand and fewer homes for sale, prices will likely continue to appreciate throughout 2021.
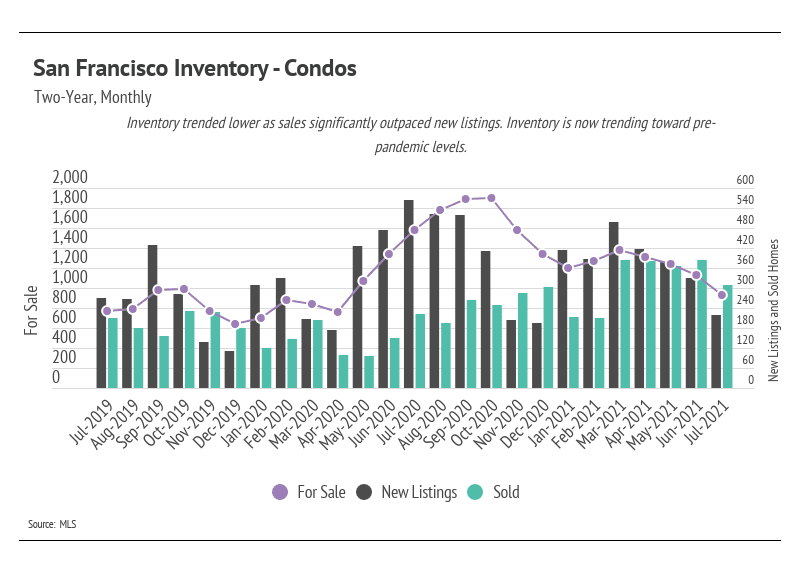
The number of condos on the market fell in July, continuing the trend toward pre-pandemic levels. Demand for condos has come back strong, and sales outpaced new listings in June and July. Sales in June 2021 significantly outpaced sales in both July 2020 and July 2019.
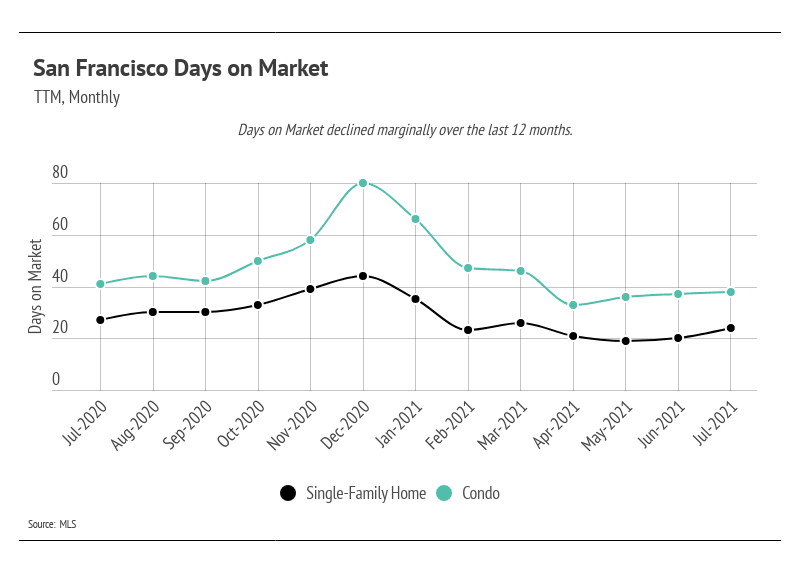
Both single-family homes and condos spent slightly less time on the market in July 2021 than they did in July of last year. As we’ll see, the pace of sales has contributed to the low Months of Supply Inventory (MSI) over the past several months.
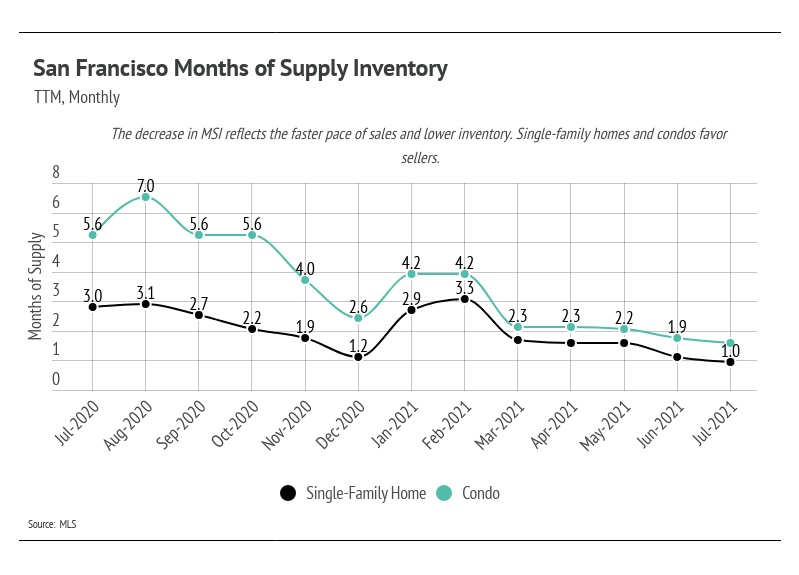
We can use MSI as a metric to judge whether the market favors buyers or sellers. The average MSI is three months in California, which indicates a balanced market. An MSI lower than three means that there are more buyers than sellers on the market (meaning it’s a sellers’ market), while a higher MSI means there are more sellers than buyers (meaning it’s a buyers’ market). In July 2021, the MSI remained below two months of supply for single-family homes and condos, indicating that the market favors seller s.
In summary, the high demand and low supply present in San Francisco have driven home prices up. Inventory will likely remain low this year with the sustained high demand in the area. Overall, the housing market has shown its value through the pandemic and remains one of the most valuable asset classes. The data show that housing has remained consistently strong throughout this period.
We expect that the number of new listings will continue to increase in the remaining summer months. The current market conditions, however, can withstand a high number of new listings coming to market, and more sellers may also enter the market to capitalize on the high buyer demand. As we navigate the summer season, we expect the high demand to continue, and new houses on the market to sell quickly.
As always, we remain committed to helping our clients achieve their current and future real estate goals. Our crew of experienced professionals is happy to discuss the information we’ve shared in this newsletter. We welcome you to contact us with any questions about the current market or to request an evaluation of your home or condo.
_________________________
_________________________
Interested in a monthly market update?
Stay up to date on the latest real estate trends.

BUSINESS
July 1, 2026

BUSINESS
June 1, 2026

BUSINESS
May 1, 2026

BUSINESS
April 1, 2026

BUSINESS
March 1, 2026

HELM Newsletter
February 1, 2026

BUSINESS
January 1, 2026

BUSINESS
December 1, 2025

BUSINESS
November 1, 2025
You’ve got questions and we can’t wait to answer them.