SAN FRANCISCO REAL ESTATE MARKET UPDATE – March 2022
March 3, 2022
BUSINESS

March 3, 2022
BUSINESS

Quick Take:
Note: You can find the charts & graphs for the Big Story at the end of the following section.
_________________________
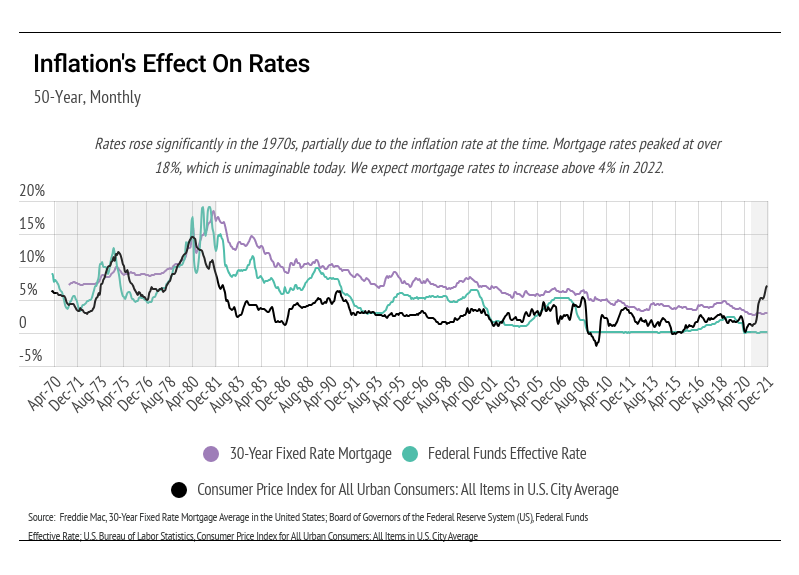
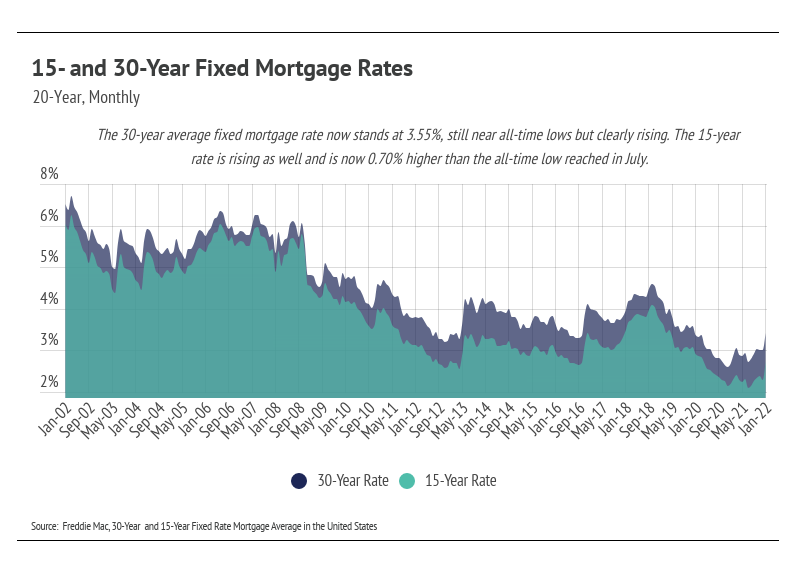
On January 26, 2022, the Federal Reserve (the Fed) indicated that it would raise the federal funds rate as soon as March for the first time in over three years. The Fed adjusts the federal funds rate to influence broader interest rates, which directly affect the borrowing costs of banks. Generally, if bank borrowing costs are low, consumer borrowing costs will be low(er), and vice versa. The Fed uses interest rates in particular as a tool to meet its dual mandate of maximum employment and price stability. Employment and price stability are long-term indicators for home prices.
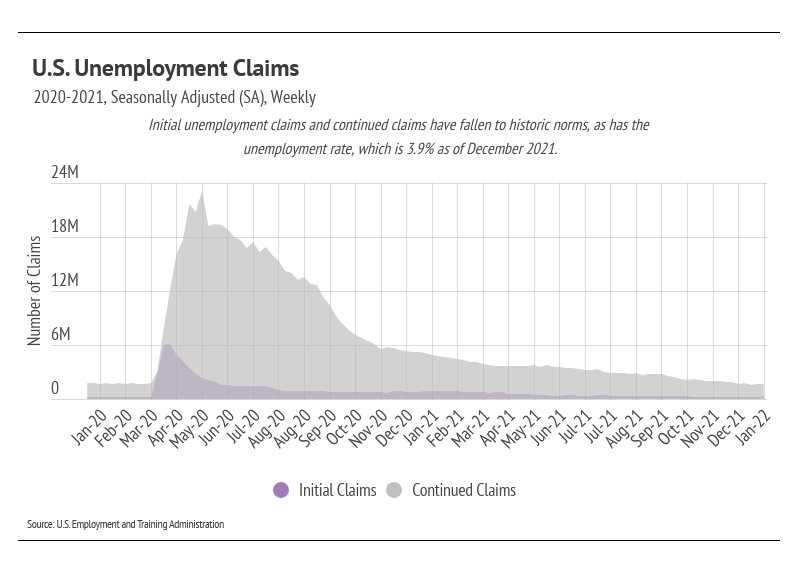
We will start with the good news. Employment rebounded considerably from the highest spike in unemployment in modern history in spring 2020 to pre-pandemic levels by December 2021. As you might imagine, high unemployment rates for extended periods lead to less overall wealth: Fewer people buy homes, and more people experience foreclosures, thereby lowering home prices. Although unemployment seemed dire in 2020, employment is now on solid ground. If we view the current record-high 10.5 million job openings, along with the nearly 10 million new businesses created over the past two years, we get a better understanding of why unemployment dropped so significantly despite a record number of job openings. Simply put, people are working, and that is good for individual wealth and the larger economy.
On to the kind-of-good, kind-of-bad news … rising mortgage rates could help curb inflation and create a more balanced housing market (although 2022 will surely be a sellers’ market), but it will make homes more expensive monthly, hitting first-time homebuyers the hardest. With the federal funds rate at 0% and inflation at a near-40-year high, rate hikes are expected to combat inflation. Essentially, when the cost to borrow increases, fewer people want to borrow, leading to less consumer spending (less demand), which lowers prices. We can look to the last inflationary period, the 1970s, as a loose guide. Inflation today is likely to be much more transitory than it was in the 1970s, but we can still expect a rise in mortgage rates like we saw then. Luckily, however, we will certainly not reach the 18+% mortgage rate that we saw in the early 1980s. As it was then, the Fed is obligated to do something now. While we wish that we could always be in periods of high employment, low inflation, and low interest rates, as we experienced for nearly a decade before the pandemic, we must recognize the atypical nature of that period.
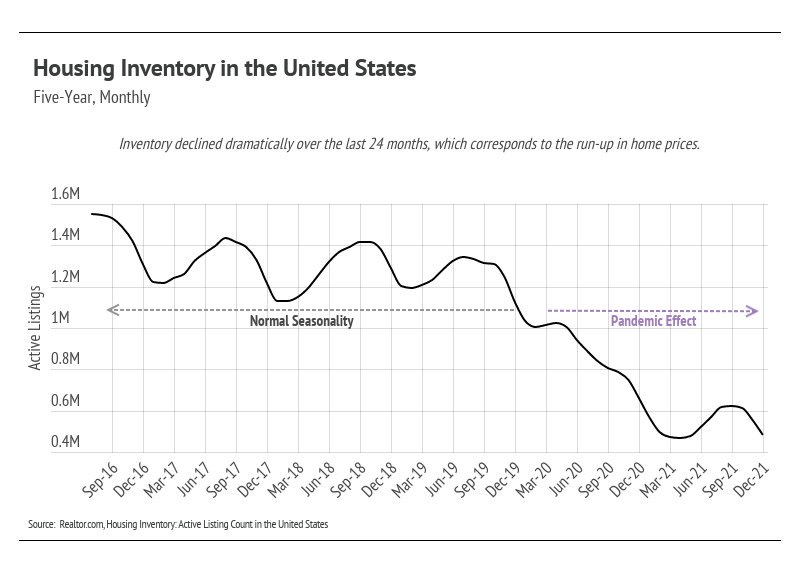
As we enter this new chapter of rising mortgage rates, we don’t expect home prices to change significantly, if at all, because supply is still such a driving factor. In December 2021, there were 57% fewer homes on the market than in December 2019. The low supply means that demand can decline without affecting prices. Does it matter if 10 offers drop to five? Probably not, and it might even create a better market. Sellers tend to become buyers, so unless you’re a first-time homebuyer, you’ll likely experience both sides of the market. Because sellers are often selling one home and buying another, it’s essential that sellers work with the right agent to ensure the transition goes smoothly.
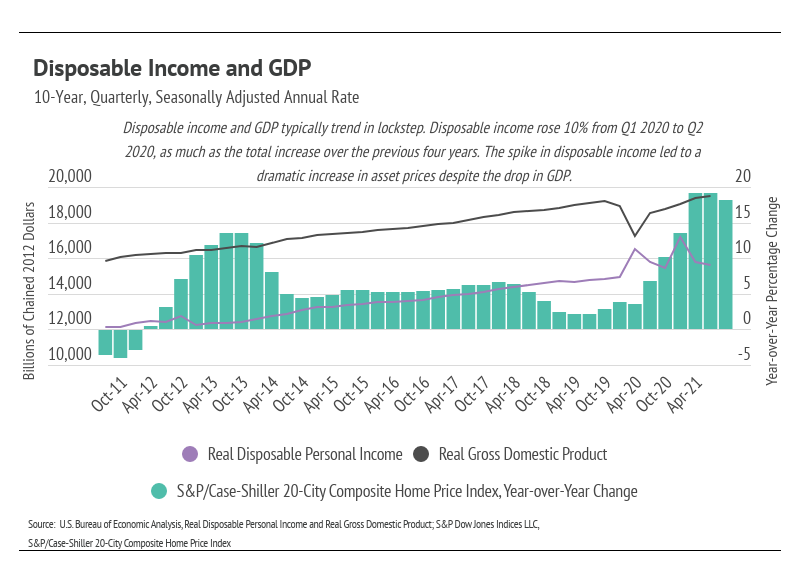
We don’t expect price appreciation to see the record gains we experienced over the past two years, but we do expect home prices to increase. Another factor at play over the past two years was a sharp increase in disposable income, which has now normalized. People had more money to spend over the past two years, and we saw that throughout markets: The housing market, the stock market, cryptos, art, jewelry, etc. all reached record high prices. As disposable income has dropped to a more normal level, we can expect assets to appreciate at a more normal pace.
_________________________
Quick Take:
Note: You can find the charts/graphs for the Local Lowdown at the end of this section.
_________________________
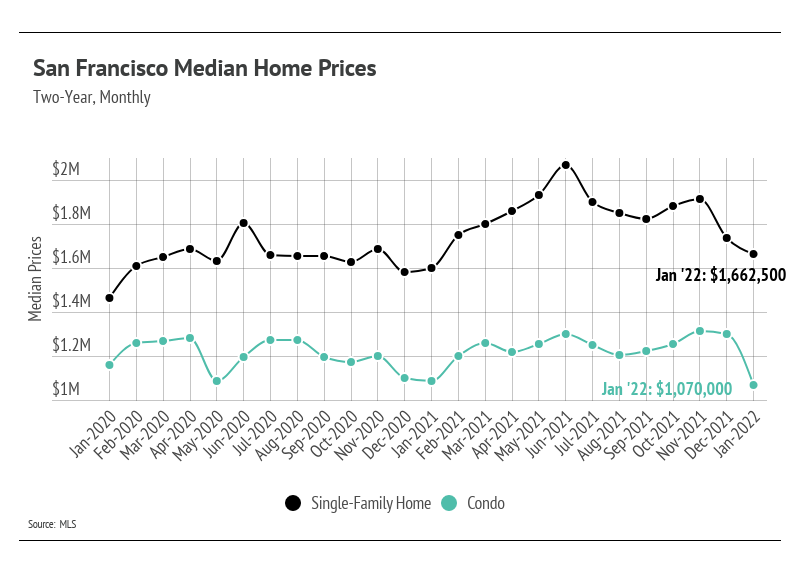
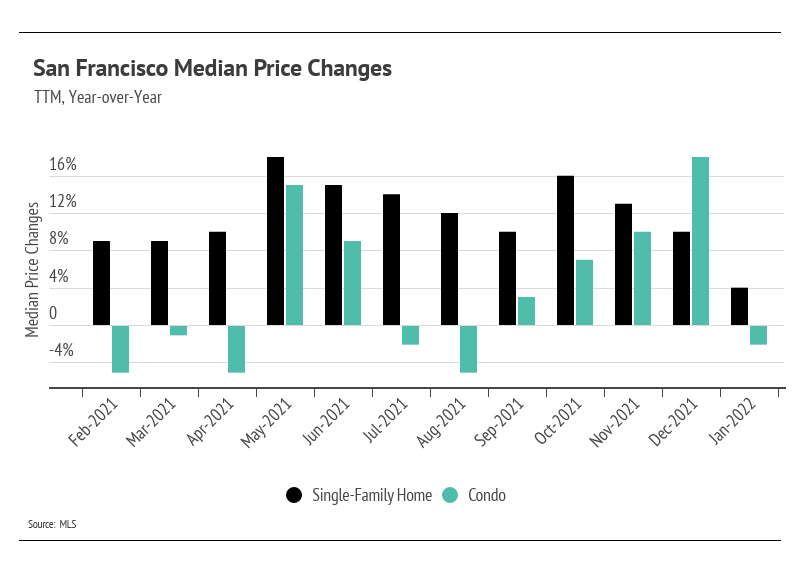
The single-family home market in San Francisco began the year below all-time highs as the market cooled from the huge price gains at the beginning of 2021. After prices appreciated significantly in the first half of 2021, it made sense that price appreciation would slow or reverse in the second half of the year, a trend that has continued into 2022. The housing market in San Francisco, however, has a major advantage in that a large number of affluent people simply want to live there, which has reduced inventory to record lows.
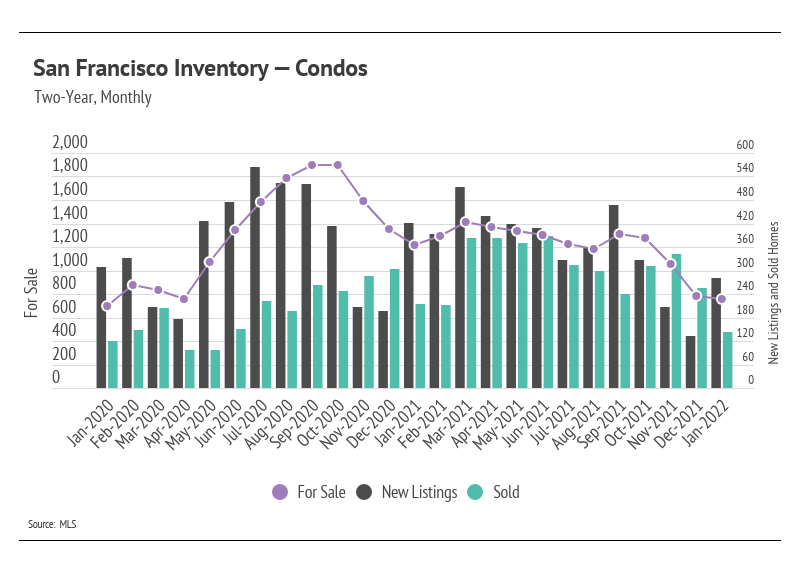
The median condo price dropped significantly in January, which gave cause to dig more into the numbers, as price per square foot increased slightly from December 2021 to January 2022. Usually, median price gives an excellent barometer of the overall market, but it is also subject to outlier months. Nearly twice as many homes sold in December than in January, and, of the condos sold, January had a far higher percentage of condos with one or fewer bedrooms. This skewed the median price downward. Long story short, condo prices didn’t actually decrease in January. The pandemic hit demand for condos harder than single-family homes in San Francisco. However, sales indicate that demand is back, although we expect price appreciation to slow as we move through the winter months, a seasonal norm.
Mortgage rate hikes really only move demand in one direction: lower. We are now entering a period during which factors that affect prices are more mixed, unlike the past two years when all the factors caused prices to increase. Rising interest rates, which will hopefully curb the still-rising inflation, will make homes less affordable and dampen demand. But inventory is so low that even with less demand, the market will likely be undersupplied. It might seem counterintuitive that home prices can still appreciate after increasing so much over the past two years, but with inventory at record lows, home prices in 2022 will still increase — though at a slower rate than in 2021.
_________________________
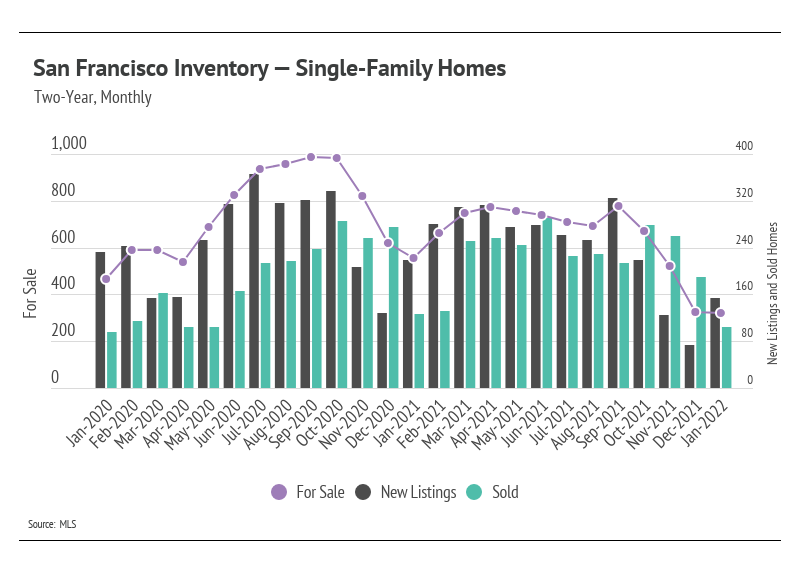
We entered 2022 with historically low inventory. The sustained high demand and lack of new listings over the past year brought supply to record lows across markets. We are seeing that far more people want to live in San Francisco than want to leave. Sales have been incredibly high, especially when accounting for available supply, again highlighting demand in the area. Sellers can expect multiple offers, and buyers should come with competitive offers. The high demand we’ve seen over the past year might wane as interest rates increase; however, the supply is so low that the market can handle a drop in demand without negatively affecting prices.
_________________________
Homes are still selling extremely quickly. Buyers must put in competitive offers, which, on average, are 11% above the list price for single-family homes and at list for condos.
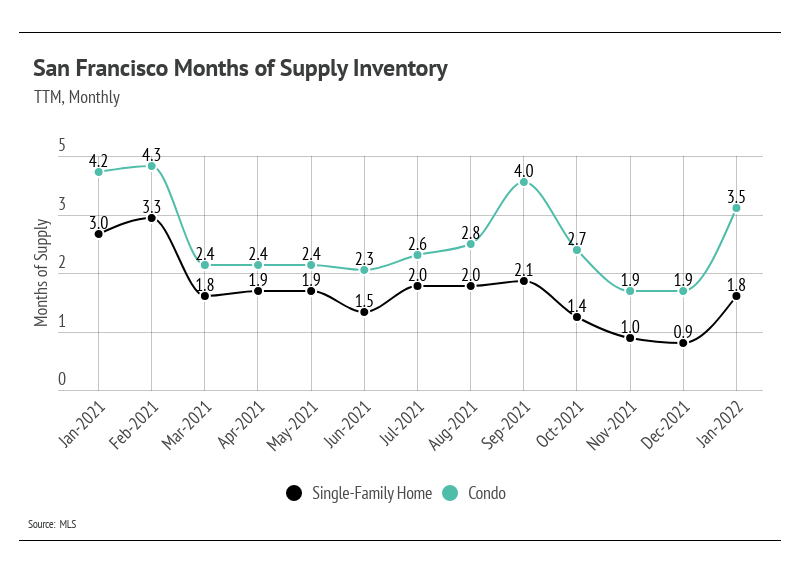
Months of Supply Inventory (MSI) quantifies the supply/demand relationship by measuring how many months it would take for all current homes on the market to sell at the current rate of sales. The average MSI is three months in California, which indicates a balanced market. An MSI lower than three indicates that there are more buyers than sellers on the market (meaning it’s a sellers’ market), while a higher MSI indicates there are more sellers than buyers (meaning it’s a buyers’ market). In January, MSI remained low for single-family homes in San Francisco, indicating a strong sellers’ market, but rose considerably for condos. Notably, the January increase in MSI is less instructive than usual — sales slowed because inventory is so low, not because of lack of demand. It’s still a sellers’ market for both single-family homes and condos.
_________________________

_________________________
If you are interested in selling, buying, or just curious about the
San Francisco and Bay Area real estate market, please give us a call.
We are here to help you and anyone you care about.
_________________________
Stay up to date on the latest real estate trends.

BUSINESS
July 1, 2025

HELM Newsletter
June 2, 2025

BUSINESS
May 1, 2025

BUSINESS
April 1, 2025

BUSINESS
March 1, 2025

BUSINESS
February 1, 2025

BUSINESS
January 1, 2025

BUSINESS
December 1, 2024

BUSINESS
November 1, 2024
You’ve got questions and we can’t wait to answer them.